Leaks in javascript
Regular users of GCC Explorer may have noticed its uptime was getting a little choppy. Having moved to using docker and no longer running the site under an auto-restarting supervisor script, the occasional shutdowns I had been intermittantly seeing became longer outages instead of a quick restart.
Rather than resurrect the seemingly unnecessary supervisor, I decided to fix the underlying problem. The main issue was that the node.js process that runs the webserver was slowly “leaking” memory and eventually my Amazon S3 instance would run out of memory. The OOM killer would then come along and whack the process – and I’d get another SMS alert telling me the site was down.
Where to start? How can a garbage collected language leak memory, anyway? Good questions. First up I added instrumentation to a few likely-looking places, but nothing obvious seemed wrong. Then I tried an NPM package called memwatch which seemed to be a step in the right direction.
I ran a bunch of compiles locally and looked at the memwatch output: nothing obviously untoward again. So I deployed the memwatch version to the public site, and kept an eye on it over a period of a couple of weeks. I use (and recommend) papertrail to aggregate all the docker logs and system logs, so with a simple query I could see all the memory usages.
Over that two week period, the site got killed several times. Each time I could see that the memory usage had been steadily increasing, and that seemingly the main thing being retained were strings. That’s no surprise: there’s a bunch of caching of the compiled output done in the server, and each compile output can be 500KB or more. I immediately suspected the LRU cache I used…but after reading the source over and over I couldn’t see how there could be any issues with it.
So what strings were being leaked after all?
I found another NPM package called
heapdump and gave that a go.
Again I had to deploy to the live site and let it stew for a couple of days to
get it anywhere near running out of memory. I then executed kill -USR2 <PID> from within
the relevant docker container to trigger a heap dump. The heap dump
loads into Google’s Chrome developer tools and let me look around at
the contents of those objects in the heap.
As expected there were a tonne of compiler output files, but I spied another set of strings that seemed a little out of place:
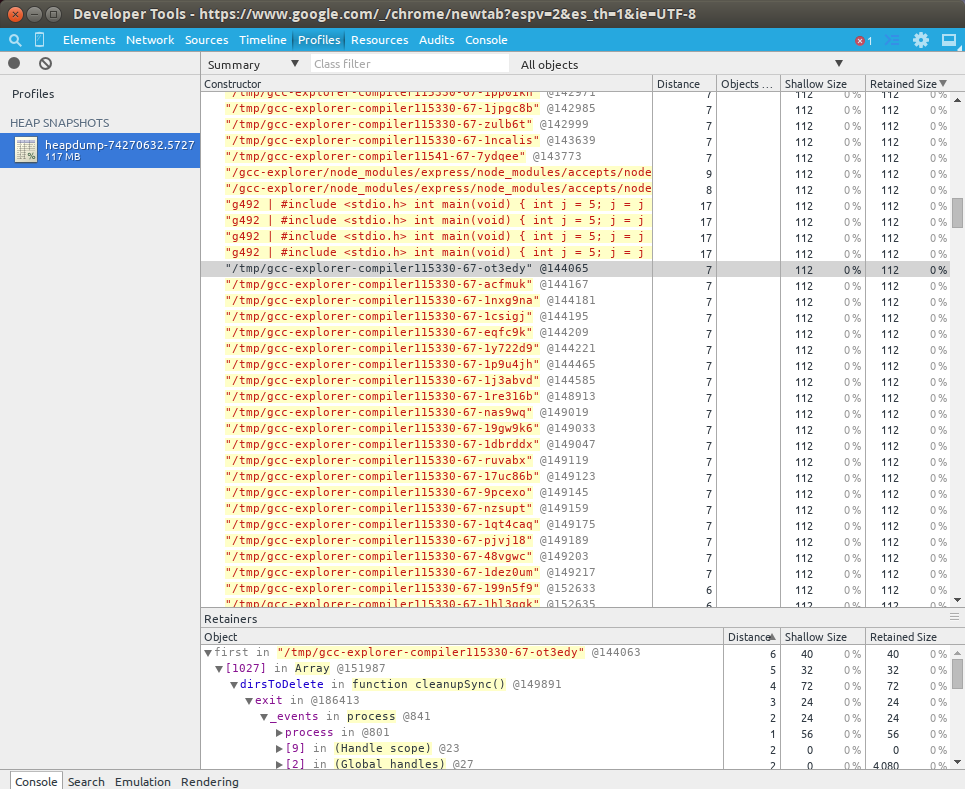
Google Chrome's heap profiler showing the offending strings
A giant list of temporary directory filenames! Looking at the “Retainers” immediately showed the culprit: another library I used called temp that’s used to make a temporary directory to run the compiler and other tools in for each compile. I always clean up the temporary directory after each compile, but I had left the library in ‘track’ mode where it keeps a list of directories and files to clean up on program termination.
Of course, this is a long-lived server, and the list was getting longer and longer with every compile. A few hundred bytes every compile, and with a few hundred thousand compiles a day, it all adds up!
Rather than give up entirely on the tracking ability, in the fix I just periodically run the cleanup code.
Now the site has been up for a week and has stabilised at a nice round 120MB of memory usage.